
[brid autoplay=”true” video=”1380460″ player=”10951″ title=”2013 Fantasy Football Tight Ends” duration=”160″ description=”0:23 Darren Waller 0:56 Cole Kmet 1:45 Kyle Pitts” uploaddate=”2023-08-13″ thumbnailurl=”https://cdn.brid.tv/live/partners/9233/snapshot/1380460_th_64d83e81af895_1691893377.jpg” image=”https://cdn.brid.tv/live/partners/9233/snapshot/1380460_sd_64d83e81af895_1691893377.jpg” contenturl=”https://cdn.brid.tv/live/partners/9233/sd/1380460.mp4″ width=”480″ height=”270″]
For those who haven’t been following me on the baseball side here @Razzball, let me introduce myself. My Razzball colleagues affectionately call me “The Lineup Builder.” Well, they probably call me a lot of other things too, but that’s a conversation for another day.

“The Lineup Builder”
During the baseball season, I pen a weekly article titled “Analytics Anonymous,” where I explore the wonderful world of baseball analytics and apply them to our fantasy baseball teams. I plan to do something similar here during the football season.
To get us started on this journey, I want to give you a primer on fantasy football analytics. Analytics can be an intimidating topic to tackle in general and even more intimidating to employ routinely in our fantasy “hobby,” but I’m here to tell you it’s not that bad. You don’t need a Ph.D. in Statistics; you just need a willingness to look at data and apply some logic.
As the information at our fingertips continues to grow, so does the depth of analytics that fuels the strategies for success. Gone are the days of relying solely on gut feelings and anecdotal knowledge — well, those days SHOULD be gone, but many still live there. It’s time to put up a “FOR SALE” sign and move to the neighborhoods where consistent Championships are won.
The new era of fantasy football demands a data-driven approach. By compiling this article today, I strive to help you gain an appreciation for some of the data there for the taking, and we’ll explore together how to make it all a little more useful for building and managing our rosters. See why they call me the lineup builder?

Before I begin, though, I want to issue a disclaimer of sorts. By no means is the information shared below an all-inclusive list of football analytics. It represents a healthy sampling of the information that is at our fingertips and, more importantly, some of the analytics that I feel can help you prepare and manage your fantasy football teams to a Championship. Make no mistake, that’s our #1 goal – WINNING! All of us here @Razzball are dedicated to just that.
Over the coming weeks, I’ll be breaking down these in more individual detail. For today though, consider this an analytics primer. Trust me, having a base knowledge of the information out there will be invaluable later as we explore the data. Numbers can be fun, and they can tell you a lot, but you need to know what to look at and how to interpret them. Again, I’ll be your guide.
So, without further ado, let’s jump right in and discuss some of the high-level terms you may be hearing some of your favorite experts discuss:
- Player Projections: With us currently in draft season, this one should be familiar to most. Player projections are simply statistical forecasts of how well a player is expected to perform in upcoming games or across a full season. Projections consider various factors such as historical performance, matchup difficulty, team dynamics, and more.
- Value-Based Drafting: Value-based drafting involves comparing a player’s projected fantasy points to the expected points of the worst starter at their position. This helps managers identify players who offer the most value relative to their position’s replacement level, aiding in draft strategy.
- Historical Data Analysis: As the name implies, historical data analysis involves looking at players’ past performance to reveal trends, breakout seasons and consistency levels. This helps us assess a player’s potential for future success.
- Regression Analysis: Regression models can help predict future player performance based on historical data and variables like age, injury history, and team changes.
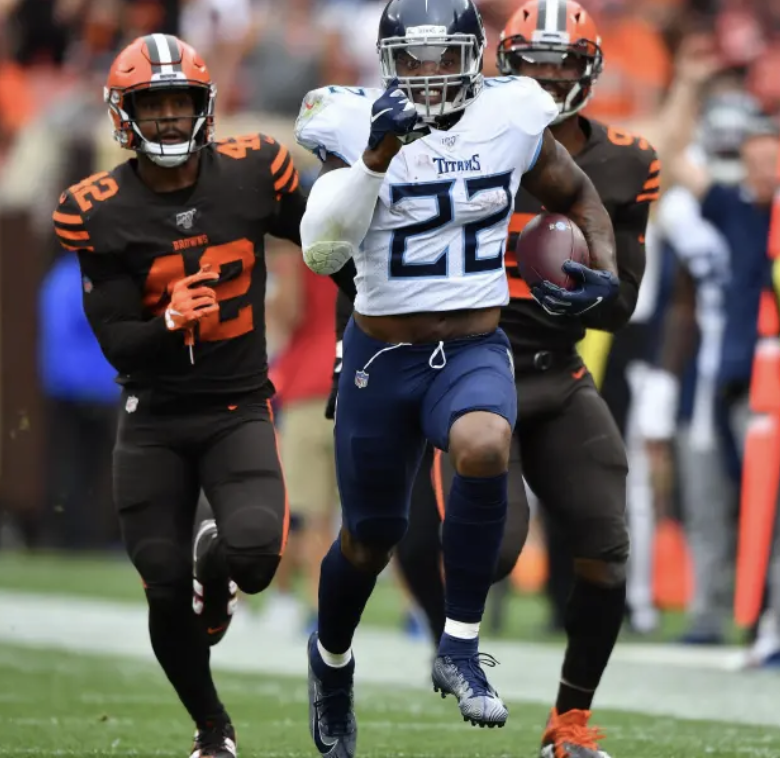
- Team-Level Analysis: Analyzing team dynamics, coaching styles, offensive and defensive schemes, and game scripts can provide insights into how player performance may be affected. This should be relatively intuitive. Derrick Henry and the Tennessee Titans are a great example to keep in mind here.
- Roster Construction: Analytics help managers build a balanced roster that optimizes points across different positions and provides depth for by weeks and potential injuries. Grab those handcuffs.
- Player Consistency Analysis: Understanding how consistent a player’s performance is over time can help managers make decisions about starting lineups and player roles.
- Game Theory: Analytics can also involve strategic decision-making based on probabilities and risk assessment, such as deciding whether to start a high-risk, high-reward player or a more consistent but lower-scoring option.
- Red Zone Analysis: Evaluating player performance in the red zone.
- Target Distribution: Studying the distribution of passes/targets among layers to predict opportunities.
- Touchdown Regression Analysis: Assessing players whose touchdown rates may be unsustainable based on historical data.
- Snap Counts and Playing Time: Analyzing the percentage of snaps a player is on the field to gauge their involvement in the offense.
- Contract Year Analysis: This one is also intuitive. For certain players in the final year of their contracts, and the money is on the line, they might find a little extra motivation for strong performances.
Now that we’ve covered many of the broad analytics let’s take a closer look at the positional analytics out there. You’ll note many of these are pretty simple to understand while others are a bit more complex. In my opinion, certain analytics are much more useful than others. Once we begin digging into the numbers, you’ll better understand which I like best and why. For this primer, though, I want you to have a good baseline to build upon.
Quarterbacks
- Completion Percentage (Comp%): The percentage of passes completed out of total attempts.
- Yards Per Attempt (YPA): The average number of passing yards gained per attempt.
- Touchdown Rate (TD%): The percentage of passes that result in TDs.
- Interception Rate (INT%): The percentage of passes that are intercepted.
- Passer Rating (PR): A composite statistic that takes into account Comp%, YPA, TDs and INTs.
- Air Yards: The total distance that a QB’s passes travel through the air before being caught.
- Deep Ball Percentage: The frequency at which a QB attempts passes beyond a certain yardage (e.g., 20+ yards).
- Red Zone Efficiency: Measures a QB’s success in gaining yards or scoring TDs in the red zone.
- Passing Directional Stats: Metrics that analyze a QB’s efficiency and effectiveness when throwing in different directions on the field.
- Adjusted Completion Percentage (aComp%): Accounts for factors like drops and throwaways to provide a more accurate assessment of a QB’s accuracy.
- Fantasy Points per Dropback (FPDB): The fantasy points a QB scores per pass attempt.
- Scramble Percentage: The frequency at which a QB scrambles or runs after evading pressure.
- Sack Rate: The percentage of dropbacks where a QB is sacked.
- Time to Throw: The average time a QB holds the ball before attempting a pass.
- Passing Under Pressure: Metrics that assess a QB’s performance when facing pressure.
- Consistency Rating: Analyzes a QB’s week-to-week consistency in producing fantasy points.
- Matchup Analysis: Evaluating the strengths and weaknesses of the opposing defense a QB will face.
Running Backs
- Yards Per Carry (YPC): The average rushing yards gained per carry, indicating an RB’s efficiency.
- Yards After Contact (YAC): Measures the number of yards gained after initial contact.
- Breakaway Run Rate: The frequency at which an RB makes long, explosive runs.
- Red Zone Efficiency: Measures an RB’s success in gaining yards or scoring TDs in the red zone.
- Goal-Line TD Rate: The percentage of times an RB scores a TD when the team is in a goal-line situation.
- Rushing Success Rate: The percentage of carries that result in positive points.
- Adjusted Line Yards: Evaluates the offensive line’s contribution to RB’s rushing yards, accounting for different yardage situations.
- Opportunity Share: The percentage of a team’s total rushing attempts.
- True Yards Per Carry (TYC): Adjusts an RB’s YPC based on the quality of the defense faced.
- Target Share: The percentage of a team’s total targets an RB receives in the passing game.
- Receiving Efficiency: Metrics like yards per target and catch rate.
- Route Participation: The percentage of passing plays where an RB runs a route, indicating their involvement in the passing game.
- Pass Blocking Efficiency: Measures an RB’s effectiveness in pass protection, crucial for staying on the field in passing situations.
- Dominator Rating: Measures the percentage of a team’s total yards and TDs by an RB.
- Consistency Rating: Analyzes an RB’s week-to-week consistency in producing fantasy points.
- Fantasy Points Per Opportunity (FPPO): The fantasy points an RB scores per touch or carry.
- Stiff Arm Rate: The frequency at which an RB uses a stiff arm to break tackles.
- Broken Tackle Rate: Measures how often an RB evades tackles attempted by defenders.
- Run Directional Stats: Metrics like off-tackle, inside, and outside running efficiency to identify an RB’s preferred running lanes.
- Breakdown of Long Runs: Analyzes the number and length of RB’s long runs and their impact.
- Fumbles Per Touch: Calculates the frequency of fumbles relative to touches.
- Snap Counts and Playing Time: Assesses the percentage of snaps a RB plays per game.
- Matchup Analysis: Analyzes an RB’s performance against types of defenses (e.g., strong run defense, weak run defense, etc.).
- Historical Trend Analysis: Studying an RB’s past performance trends to identify breakout potential or declining performance.
Wide Receivers/Tight Ends
- Target Share: The percentage of a team’s total targets.
- Catch Rate: The percentage of targets a WR/TE successfully catches.
- Yards Per Target (YPT): The average number of yards gained per target.
- Yards Per Reception (YPR): The average number of yards gained per reception.
- Yards After Catch (YAC): Measures the number of yards gained after making a catch.
- Deep Ball Targets and Receptions: The number of targets and receptions for passes beyond a certain yardage threshold (e.g., 20+ yards).
- Red Zone Targets and TDs: The number of targets and TDs in the red zone.
- Contested Catch Rate: Measures a WR’s/TE’s success in catching passes when closely defended.
- Average Depth of Target (aDOT): The average distance a target is thrown down the field.
- Target Separation: The average distance between the WR/TE and the nearest defender when the ball arrives.
- Dominator Rating: Measures the percentage of a team’s total yards and TDs by a WR/TE.
- Fantasy Points Per Game (FPPG): The average number of fantasy points a WR/TE scores per game.
- Fantasy Points Per Target (FPPT): The fantasy points scored per target.
- Route Participation: The percentage of passing plays where a WR/TE runs a route.
- Receiver Air Conversion Ratio (RACR): Measures a WR’s/TE’s ability to convert air yards into receiving yards.
- Yards Per Route Run (YPRR): The average number of receiving yards gained per route run.
- Consistency Rating: Analyzes a WR’s/TE’s week-to-week consistency in producing fantasy points.
- Snap Counts and Playing Time: Assesses the percentage of snaps a WR/TE plays per game.
- Historical Trend Analysis: Studying a WR’s/TE’s past performance trends to identify breakout potential or declining performance.
- Matchup Analysis: Evaluating the strengths and weaknesses of the opposing defense a WR/TE will face.
- Slot vs Outside Performance: Comparing a WR’s/TE’s production when lined up in the slot versus outside.
- Target Distribution: Analyzing how targets are distributed.
Kickers
There are plenty of analytics involving kickers, but these are all pretty straightforward, and so I’ll pass on them here. Personally, I can do without kickers in fantasy football. They are the Rodney Dangerfields of fantasy football. I mean, unless you draft Justin Tucker, does it really matter?
However, kickers are here, and their points count just the same as positional players, so we have to deal with it. All too often, a long kick or a missed kick is the difference between a win and a loss. In fact, I’ve won a Championship because my opponent’s kicker missed a FG late in the game. I’ve also lost a playoff game because of my kicker doing the same. I know you can relate too. Again, let’s just acknowledge we have to deal with them and move on.
Team Defense

- Points/Yards Allowed: The total number of points/yards allowed by a team defense.
- Turnovers Forced: INTs and fumble recoveries.
- Sacks: You guessed it, the number of tackles of the opposing QB behind the line of scrimmage.
- Opponent Red Zone Efficiency: Measures how effective a team defense is at preventing TDs in the red zone.
- Opponent Third-Down Conversion Rate: The percentage of third-down attempts that an opposing offense converts.
- Opponent Time of Possession: The amount of time an opposing offense controls the ball.
- Defensive Efficiency: A metric that evaluates a defense’s performance on a play-by-play basis, adjusted for game situations.
- Sack Rate: The percentage of dropbacks where a defense sacks the QB.
- Interception Rate: The percentage of passes thrown by opposing QBs that are intercepted.
- Fumble Recovery Rate: The percentage of fumbles that are recovered by a defense.
- Tackle for Loss Rate: Measures how often a team defense makes tackles that result in a loss of yards.
- Defensive TD Rate: The percentage of opponent drives that end in a TD scored by the defense.
- Yards Per Play Allowed: The average number of yards gained by opposing offenses.
- Defensive Red Zone Efficiency: Measures how effective a team’s defense is at preventing TDs in the red zone.
- Opponent Target Distribution: Analyzing the distribution of passes/targets among different positions against the defense.
- Opponent Rushing/Passing Efficiency: Measures how efficient opposing RBs/QBs/WRs/TEs are against a team’s defense.
- Defensive Snap Counts: Assessing the number of snaps played by individual defensive players to understand depth and rotation.
- Tackles for Loss (TFL): The number of tackles made by a team defense that result in a loss of yards.
- Defensive Formation Usage: Analyzing the frequency of different defensive formations and their effectiveness.
- Game Script Analysis: Evaluating how a team defense performs in different game situations, such as when playing with a lead or trailing.
If you’ve made it this far, thanks for sticking around. We’ve covered a lot of ground here. Again, many of these analytics are straightforward and intuitive, while others are a little more conceptual.
I certainly don’t mean to insult anyone’s intelligence here but wanted to provide a thorough list to refer back to. Did I miss any that you like to use? If so, feel free to share in the chat below.
Remember, we’re going to build on many of these analytics in the coming weeks and throughout the season. Bookmarking this article may be a good idea but also know I’ll provide links back to it when appropriate.
As I always say in my baseball articles, keep sifting through the numbers and see where it takes you. Sometimes the conclusions are obvious, and other times, not so much. No matter what, though, it’s always a fun ride.
We’ll start digging into the numbers next time. Until then, be sure to visit Razzball for all your draft prep needs.
For more of my @Razzball content, you can follow me on Twitter/X at @Derek_Favret.
Until next time, my friends!