
As of early August 2019, David Johnson appears to be the consensus 5th pick after Barkley/CMC/Elliott/Kamara. Below is a screenshot from our RazzBowl partner’s NFFC ADP
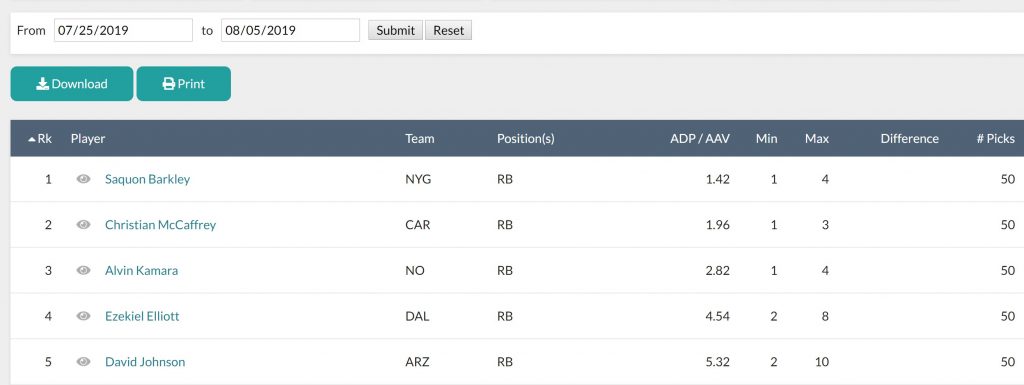
My projections have David Johnson as RB8 for PPR (behind the top 4 in ADP as well as Le’Veon Bell, Joe Mixon, and James Conner) so I’m quite divergent from the consensus on this one. I had pick #5 in my RazzBowl draft and went with Davante Adams (ADP #7) when no one was kind enough to let one of the top four fall to me.
***NOTE – Early-bird discount still available through August 10th on 2019 Razzball Fantasy Football subscriptions. Just $19.98 for season-long weekly projections/rankings and $99.99 includes DFS projections including lineup optimizer. Incidentally, I finished 1st in RBs in 2017 and 9th in 2018.***
I think the pro-David Johnson case can be summarized as follows:
- Johnson’s 2018 usage and the 2019 Cardinal RB depth chart suggests his ‘bell cow’ status is as secure as it gets for the NFL.
- You can disregard any Yards per Rush/Target because the Cardinals offense was an absolute shitshow. “McCoy kept running him up the middle! David Johnson excels in open space!” History has shown he has solid efficiency in the running game and he is elite in the passing game (for an RB).
- He will see a spike in volume because Kliff Kingsbury’s Air Raid offense will increase the Cardinals’ league worst number of plays both through less sucking and quicker pace.
- Kingsbury will utilize Johnson’s skill set similar to his monster 2016 season.
I am on board with #1 and #2. I agree with #3 to an extent. It is #4 that I am skeptical on and did some analysis to confirm those suspicions.
Note I am not worried about David Johnson’s rushing volume. I have him down for around 220 rushes which is roughly the Alvin Kamara range. Like Kamara, David Johnson’s biggest value is in the passing game and that is where my concerns lie.
I am not a film junkie but I have some familiarity with both Kyler Murray and the Air Raid system since I live in Big 12 country (Hook ’em Horns!). Here were my three main concerns re: David Johnson’s passing game usage based on my experience with the QB and the system:
- Kyler Murray in Lincoln Riley’s version of the Air Raid attacked defenses downfield using WRs vs dumping off to an RB.
- When downfield options did not materialize and/or there was pressure, Kyler Murray often scrambles (where he excels) vs dumping off to an RB.
- Kliff’s version of the Air Raid system is built around passing to WRs in 3-5 WR sets. In his years at Texas Tech, the top 4-5 target leaders on the team were WRs. This is a system that produces Wes Welkers, Michael Crabtrees and Keke Coutees not David Johnsons.
To test my hypotheses, I analyzed whether a team’s RB share of targets are impacted by two factors: 1) QB rushing and 2) A team’s average WR/snap. I have Kyler Murray at around 500 rushing yards and the Cardinals average about 3 WR/snap which would both be top 10th percentile based on 2016-2018 totals.
The below table has the following data from 2016-2018:
- QB Rush attempts and Yards. This includes designated runs and scrambles (I don’t have an easy way to separate the two)
- Average WR/Snap – The league average for 2016-2018 is 2.6 WRs/snap with 2.1/3.1 the floor/ceiling
- RB Targets and their share of team targets
| Download Table as CSV | |||
| Note: Filters and sorting in the table below apply to the output | |||
| # | Team | Season | QB Rush | QB Rush Yds | Avg WR/Snap | RB Tgts | RB Tgt % |
|---|---|---|---|---|---|---|---|
| BAL | 2019 | 196 | 1275 | 2.2 | 64 | 16 | |
| CHI | 2022 | 167 | 1151 | 0.0 | 76 | 20 | |
| BAL | 2020 | 186 | 1113 | 2.2 | 63 | 15 | |
| BAL | 2021 | 180 | 1061 | 2.4 | 87 | 14 | |
| WAS | 2024 | 166 | 983 | 2.5 | 79 | 15 | |
| BAL | 2022 | 158 | 896 | 0.0 | 63 | 14 | |
| BAL | 2024 | 143 | 896 | 2.1 | 82 | 17 | |
| BAL | 2023 | 163 | 876 | 2.5 | 79 | 17 | |
| ARI | 2020 | 137 | 834 | 2.8 | 101 | 18 | |
| PHI | 2021 | 149 | 803 | 2.4 | 106 | 22 | |
| BUF | 2021 | 137 | 784 | 2.8 | 96 | 15 | |
| NYG | 2022 | 125 | 778 | 0.0 | 109 | 23 | |
| PHI | 2022 | 171 | 762 | 0.0 | 61 | 12 | |
| CHI | 2023 | 149 | 762 | 2.5 | 113 | 22 | |
| BUF | 2022 | 129 | 762 | 0.0 | 109 | 20 | |
| CAR | 2017 | 141 | 750 | 2.2 | 135 | 25 | |
| BAL | 2018 | 166 | 742 | 2.3 | 75 | 13 | |
| BUF | 2018 | 103 | 678 | 2.3 | 97 | 20 | |
| ARI | 2023 | 121 | 665 | 2.6 | 69 | 13 | |
| PHI | 2023 | 165 | 657 | 2.7 | 93 | 17 | |
| PHI | 2024 | 164 | 644 | 2.5 | 69 | 16 | |
| PHI | 2020 | 117 | 644 | 2.5 | 97 | 16 | |
| SF | 2016 | 109 | 641 | 2.9 | 86 | 18 | |
| WAS | 2025 | 120 | 630 | 2.5 | 54 | 13 | |
| NYG | 2025 | 111 | 616 | 2.6 | 98 | 19 | |
| NE | 2020 | 145 | 607 | 2.0 | 122 | 29 | |
| BUF | 2016 | 104 | 601 | 2.1 | 90 | 19 | |
| NYG | 2023 | 114 | 598 | 2.7 | 88 | 17 | |
| BUF | 2025 | 121 | 585 | 2.3 | 88 | 18 | |
| SEA | 2017 | 96 | 585 | 2.6 | 104 | 19 | |
| ARI | 2019 | 100 | 585 | 2.8 | 68 | 13 | |
| LAC | 2025 | 100 | 583 | 2.5 | 82 | 16 | |
| NYJ | 2025 | 111 | 575 | 1.8 | 85 | 19 | |
| ARI | 2024 | 85 | 568 | 2.3 | 95 | 19 | |
| HOU | 2018 | 100 | 550 | 1.9 | 68 | 12 | |
| IND | 2024 | 95 | 538 | 2.7 | 65 | 13 | |
| CAR | 2018 | 111 | 538 | 2.6 | 139 | 26 | |
| BUF | 2024 | 119 | 532 | 2.6 | 82 | 17 | |
| BUF | 2023 | 124 | 511 | 2.6 | 86 | 15 | |
| SEA | 2020 | 85 | 511 | 2.5 | 99 | 18 | |
| ARI | 2022 | 98 | 508 | 0.0 | 112 | 17 | |
| BUF | 2019 | 111 | 506 | 2.6 | 82 | 15 | |
| CHI | 2021 | 92 | 504 | 2.4 | 91 | 17 | |
| BUF | 2017 | 99 | 504 | 1.4 | 108 | 20 | |
| ATL | 2022 | 101 | 502 | 0.0 | 66 | 18 | |
| NE | 2024 | 79 | 499 | 2.6 | 83 | 16 | |
| BAL | 2025 | 95 | 496 | 2.1 | 72 | 19 | |
| CLE | 2017 | 88 | 489 | 2.6 | 146 | 25 | |
| JAC | 2018 | 77 | 488 | 2.6 | 128 | 25 | |
| CHI | 2024 | 87 | 482 | 2.7 | 87 | 17 | |
| ARI | 2021 | 112 | 466 | 2.8 | 103 | 18 | |
| CAR | 2021 | 102 | 465 | 2.5 | 95 | 16 | |
| HOU | 2019 | 87 | 452 | 2.4 | 79 | 14 | |
| KC | 2025 | 76 | 446 | 2.5 | 89 | 16 | |
| NE | 2025 | 113 | 445 | 2.4 | 83 | 18 | |
| PIT | 2024 | 105 | 444 | 2.2 | 110 | 23 | |
| HOU | 2020 | 90 | 444 | 2.7 | 90 | 17 | |
| DEN | 2024 | 96 | 435 | 2.7 | 117 | 22 | |
| NYG | 2020 | 74 | 435 | 2.3 | 83 | 17 | |
| KC | 2023 | 82 | 434 | 2.3 | 108 | 18 | |
| TB | 2018 | 85 | 433 | 2.7 | 88 | 14 | |
| NYG | 2024 | 93 | 430 | 2.7 | 88 | 16 | |
| PHI | 2025 | 113 | 429 | 2.9 | 65 | 15 | |
| CHI | 2018 | 81 | 424 | 2.4 | 129 | 23 | |
| BUF | 2020 | 108 | 414 | 2.8 | 79 | 13 | |
| CLE | 2022 | 84 | 413 | 0.0 | 84 | 17 | |
| NYG | 2021 | 77 | 396 | 2.4 | 116 | 20 | |
| GB | 2017 | 61 | 393 | 2.8 | 97 | 18 | |
| CHI | 2025 | 79 | 390 | 2.5 | 77 | 15 | |
| TB | 2025 | 58 | 386 | 2.7 | 84 | 17 | |
| KC | 2021 | 74 | 381 | 2.6 | 112 | 17 | |
| SEA | 2018 | 67 | 376 | 2.5 | 85 | 21 | |
| JAC | 2023 | 78 | 374 | 2.5 | 91 | 15 | |
| TB | 2024 | 65 | 374 | 2.7 | 121 | 21 | |
| LAC | 2023 | 79 | 372 | 2.6 | 94 | 15 | |
| DAL | 2017 | 59 | 370 | 2.5 | 75 | 16 | |
| TEN | 2016 | 64 | 368 | 2.2 | 84 | 17 | |
| GB | 2016 | 70 | 367 | 2.7 | 99 | 16 | |
| JAC | 2019 | 71 | 367 | 2.7 | 133 | 24 | |
| SEA | 2022 | 68 | 366 | 0.0 | 78 | 13 | |
| CAR | 2016 | 91 | 363 | 2.4 | 70 | 13 | |
| WAS | 2018 | 75 | 359 | 2.7 | 108 | 22 | |
| JAC | 2016 | 59 | 357 | 2.7 | 109 | 18 | |
| TEN | 2018 | 70 | 357 | 2.5 | 85 | 20 | |
| DEN | 2025 | 84 | 355 | 2.4 | 117 | 19 | |
| NO | 2025 | 76 | 353 | 2.9 | 77 | 13 | |
| CLE | 2024 | 77 | 353 | 3.0 | 84 | 14 | |
| KC | 2022 | 66 | 353 | 0.0 | 112 | 18 | |
| JAC | 2025 | 94 | 351 | 2.2 | 81 | 16 | |
| SF | 2024 | 78 | 351 | 2.5 | 91 | 18 | |
| DEN | 2023 | 89 | 349 | 2.5 | 153 | 33 | |
| GB | 2025 | 74 | 345 | 2.5 | 72 | 17 | |
| IND | 2016 | 70 | 344 | 2.5 | 109 | 19 | |
| SEA | 2019 | 75 | 342 | 2.5 | 84 | 15 | |
| ARI | 2025 | 67 | 341 | 2.2 | 124 | 19 | |
| CLE | 2016 | 59 | 335 | 2.5 | 139 | 24 | |
| KC | 2017 | 68 | 333 | 2.3 | 114 | 19 | |
| JAC | 2021 | 73 | 332 | 2.8 | 93 | 17 | |
| LAC | 2024 | 71 | 326 | 2.5 | 60 | 13 | |
| WAS | 2021 | 62 | 325 | 2.8 | 123 | 23 | |
| HOU | 2017 | 46 | 324 | 2.6 | 77 | 16 | |
| ATL | 2023 | 69 | 323 | 1.7 | 124 | 25 | |
| JAC | 2017 | 61 | 318 | 2.2 | 132 | 25 | |
| TEN | 2019 | 67 | 314 | 2.2 | 63 | 14 | |
| TEN | 2017 | 60 | 312 | 2.1 | 66 | 12 | |
| PHI | 2017 | 76 | 310 | 2.6 | 61 | 10 | |
| GB | 2018 | 48 | 308 | 2.7 | 118 | 19 | |
| KC | 2024 | 61 | 307 | 2.0 | 94 | 17 | |
| DAL | 2018 | 75 | 305 | 2.2 | 112 | 20 | |
| CAR | 2020 | 62 | 301 | 2.6 | 114 | 22 | |
| LAC | 2021 | 65 | 300 | 2.5 | 131 | 19 | |
| KC | 2020 | 70 | 300 | 2.7 | 94 | 15 | |
| CLE | 2025 | 56 | 290 | 2.3 | 112 | 22 | |
| TEN | 2024 | 70 | 289 | 2.9 | 95 | 19 | |
| JAC | 2022 | 66 | 287 | 0.0 | 85 | 15 | |
| NYG | 2019 | 49 | 286 | 2.7 | 99 | 17 | |
| DEN | 2022 | 61 | 284 | 0.0 | 91 | 17 | |
| CAR | 2024 | 54 | 283 | 3.0 | 90 | 18 | |
| WAS | 2023 | 51 | 282 | 2.7 | 105 | 17 | |
| DAL | 2016 | 62 | 279 | 2.6 | 97 | 20 | |
| DAL | 2019 | 52 | 277 | 2.6 | 94 | 16 | |
| TEN | 2020 | 50 | 276 | 2.2 | 58 | 11 | |
| PIT | 2022 | 74 | 275 | 0.0 | 93 | 17 | |
| KC | 2018 | 61 | 275 | 2.6 | 97 | 18 | |
| SEA | 2024 | 54 | 274 | 2.8 | 110 | 19 | |
| CLE | 2023 | 69 | 272 | 2.7 | 96 | 17 | |
| HOU | 2025 | 61 | 269 | 2.6 | 77 | 14 | |
| CAR | 2023 | 42 | 265 | 2.9 | 92 | 17 | |
| TEN | 2022 | 69 | 265 | 0.0 | 85 | 20 | |
| TEN | 2021 | 61 | 264 | 2.7 | 104 | 19 | |
| MIA | 2020 | 66 | 260 | 2.4 | 96 | 18 | |
| SEA | 2016 | 80 | 260 | 2.5 | 96 | 16 | |
| DAL | 2020 | 55 | 257 | 2.7 | 113 | 18 | |
| NYJ | 2023 | 51 | 256 | 2.7 | 160 | 30 | |
| CLE | 2018 | 55 | 256 | 3.0 | 118 | 21 | |
| MIA | 2019 | 57 | 256 | 2.5 | 155 | 25 | |
| CIN | 2022 | 78 | 256 | 0.0 | 132 | 24 | |
| IND | 2017 | 66 | 256 | 2.6 | 86 | 18 | |
| MIN | 2025 | 55 | 249 | 2.8 | 80 | 16 | |
| TB | 2019 | 63 | 249 | 2.6 | 114 | 19 | |
| DET | 2019 | 50 | 248 | 2.5 | 101 | 19 | |
| CHI | 2017 | 45 | 247 | 2.4 | 133 | 29 | |
| GB | 2023 | 53 | 245 | 2.5 | 94 | 17 | |
| HOU | 2024 | 55 | 244 | 2.6 | 105 | 20 | |
| PHI | 2019 | 64 | 241 | 1.6 | 114 | 18 | |
| NO | 2024 | 46 | 239 | 1.8 | 130 | 26 | |
| LAC | 2020 | 62 | 239 | 2.6 | 130 | 22 | |
| NYJ | 2020 | 43 | 239 | 2.7 | 99 | 21 | |
| DAL | 2023 | 67 | 237 | 2.6 | 100 | 17 | |
| LV | 2020 | 49 | 237 | 2.3 | 112 | 21 | |
| IND | 2023 | 59 | 236 | 2.8 | 83 | 15 | |
| CAR | 2022 | 63 | 234 | 0.0 | 149 | 35 | |
| IND | 2019 | 64 | 230 | 2.5 | 91 | 18 | |
| CIN | 2018 | 41 | 229 | 2.7 | 111 | 21 | |
| CIN | 2020 | 61 | 229 | 2.9 | 102 | 18 | |
| DAL | 2025 | 58 | 227 | 2.7 | 82 | 12 | |
| DEN | 2017 | 49 | 226 | 2.6 | 114 | 20 | |
| SEA | 2021 | 52 | 225 | 2.6 | 68 | 14 | |
| IND | 2021 | 60 | 224 | 2.6 | 115 | 23 | |
| GB | 2024 | 45 | 221 | 2.4 | 73 | 15 | |
| WAS | 2022 | 55 | 217 | 0.0 | 120 | 23 | |
| KC | 2019 | 48 | 217 | 2.6 | 111 | 21 | |
| CIN | 2023 | 58 | 215 | 2.8 | 89 | 16 | |
| NYJ | 2021 | 45 | 215 | 2.8 | 131 | 23 | |
| SF | 2021 | 76 | 215 | 2.4 | 98 | 20 | |
| CAR | 2025 | 59 | 214 | 2.6 | 93 | 19 | |
| JAC | 2024 | 54 | 211 | 2.5 | 83 | 16 | |
| TB | 2017 | 49 | 211 | 2.5 | 95 | 16 | |
| MIN | 2024 | 70 | 210 | 2.5 | 75 | 14 | |
| DET | 2016 | 37 | 207 | 2.7 | 111 | 18 | |
| SF | 2025 | 70 | 206 | 2.5 | 169 | 30 | |
| CIN | 2024 | 44 | 199 | 2.6 | 92 | 14 | |
| CHI | 2019 | 54 | 199 | 2.6 | 164 | 28 | |
| MIA | 2021 | 61 | 198 | 2.3 | 95 | 17 | |
| MIA | 2024 | 47 | 197 | 2.3 | 131 | 23 | |
| LV | 2021 | 55 | 197 | 2.0 | 145 | 24 | |
| HOU | 2022 | 58 | 196 | 0.0 | 132 | 23 | |
| HOU | 2021 | 37 | 195 | 2.5 | 117 | 23 | |
| NO | 2021 | 44 | 192 | 2.1 | 108 | 22 | |
| CHI | 2020 | 50 | 192 | 2.4 | 111 | 17 | |
| DAL | 2022 | 54 | 188 | 0.0 | 85 | 15 | |
| LV | 2022 | 38 | 186 | 0.0 | 112 | 21 | |
| IND | 2025 | 57 | 184 | 2.9 | 77 | 14 | |
| CIN | 2016 | 46 | 184 | 2.6 | 99 | 18 | |
| DEN | 2020 | 55 | 183 | 2.6 | 72 | 13 | |
| NE | 2023 | 43 | 179 | 2.4 | 131 | 24 | |
| NYJ | 2017 | 44 | 179 | 2.5 | 131 | 26 | |
| WAS | 2017 | 49 | 179 | 2.6 | 103 | 18 | |
| GB | 2019 | 51 | 176 | 2.7 | 130 | 24 | |
| NYJ | 2022 | 46 | 171 | 0.0 | 124 | 20 | |
| NYJ | 2018 | 49 | 170 | 2.5 | 102 | 21 | |
| JAC | 2020 | 35 | 170 | 2.7 | 115 | 19 | |
| SEA | 2023 | 42 | 169 | 2.6 | 86 | 16 | |
| TB | 2016 | 52 | 168 | 2.4 | 83 | 16 | |
| HOU | 2023 | 43 | 167 | 2.6 | 84 | 15 | |
| MIA | 2018 | 40 | 166 | 2.6 | 103 | 25 | |
| IND | 2022 | 46 | 165 | 0.0 | 127 | 21 | |
| CLE | 2020 | 54 | 165 | 2.0 | 79 | 16 | |
| MIA | 2016 | 40 | 163 | 2.9 | 87 | 17 | |
| TB | 2023 | 63 | 162 | 2.7 | 94 | 17 | |
| SF | 2023 | 60 | 159 | 2.2 | 112 | 25 | |
| TEN | 2025 | 39 | 159 | 2.9 | 93 | 17 | |
| DEN | 2021 | 40 | 159 | 2.5 | 94 | 18 | |
| NYJ | 2016 | 40 | 159 | 3.1 | 122 | 22 | |
| MIN | 2020 | 32 | 156 | 2.2 | 95 | 19 | |
| CLE | 2021 | 49 | 156 | 2.7 | 83 | 16 | |
| LAR | 2020 | 57 | 155 | 2.5 | 72 | 12 | |
| MIN | 2017 | 45 | 154 | 2.5 | 109 | 21 | |
| NE | 2016 | 54 | 153 | 2.3 | 129 | 23 | |
| TEN | 2023 | 47 | 152 | 2.5 | 106 | 23 | |
| LAC | 2022 | 55 | 151 | 0.0 | 177 | 26 | |
| SF | 2017 | 50 | 151 | 2.4 | 166 | 28 | |
| CIN | 2019 | 42 | 150 | 2.9 | 88 | 15 | |
| PHI | 2016 | 46 | 150 | 1.8 | 110 | 18 | |
| GB | 2020 | 54 | 146 | 2.5 | 114 | 22 | |
| DET | 2020 | 32 | 146 | 2.5 | 129 | 24 | |
| ARI | 2018 | 25 | 145 | 2.7 | 109 | 23 | |
| ATL | 2019 | 37 | 144 | 2.9 | 112 | 17 | |
| HOU | 2016 | 36 | 143 | 2.4 | 83 | 14 | |
| ATL | 2017 | 32 | 143 | 2.3 | 96 | 18 | |
| IND | 2018 | 53 | 141 | 2.4 | 126 | 19 | |
| LAR | 2023 | 41 | 140 | 3.3 | 81 | 15 | |
| LV | 2025 | 47 | 138 | 2.7 | 95 | 19 | |
| CLE | 2019 | 31 | 138 | 2.6 | 117 | 23 | |
| LAR | 2022 | 40 | 131 | 0.0 | 63 | 11 | |
| DEN | 2019 | 40 | 131 | 2.9 | 124 | 25 | |
| KC | 2016 | 52 | 130 | 2.4 | 92 | 17 | |
| MIN | 2021 | 31 | 129 | 2.5 | 164 | 28 | |
| GB | 2021 | 47 | 127 | 2.7 | 106 | 17 | |
| WAS | 2019 | 32 | 127 | 2.8 | 105 | 22 | |
| CAR | 2019 | 44 | 126 | 2.6 | 155 | 26 | |
| ATL | 2018 | 34 | 125 | 2.6 | 89 | 14 | |
| LV | 2024 | 49 | 124 | 3.0 | 103 | 17 | |
| DAL | 2021 | 57 | 123 | 2.6 | 118 | 18 | |
| MIN | 2018 | 44 | 123 | 2.6 | 97 | 17 | |
| NE | 2021 | 54 | 121 | 2.2 | 110 | 21 | |
| NYJ | 2024 | 25 | 120 | 2.3 | 115 | 20 | |
| MIA | 2022 | 41 | 118 | 0.0 | 96 | 16 | |
| PIT | 2019 | 43 | 118 | 2.5 | 111 | 23 | |
| CIN | 2021 | 47 | 117 | 2.7 | 98 | 18 | |
| PIT | 2023 | 68 | 116 | 2.6 | 114 | 23 | |
| SF | 2022 | 63 | 116 | 0.0 | 69 | 14 | |
| ATL | 2016 | 37 | 115 | 2.3 | 117 | 22 | |
| DAL | 2024 | 50 | 113 | 2.6 | 86 | 14 | |
| PIT | 2018 | 35 | 109 | 2.8 | 110 | 16 | |
| PHI | 2018 | 45 | 108 | 2.0 | 102 | 17 | |
| MIN | 2022 | 35 | 105 | 0.0 | 88 | 14 | |
| NE | 2022 | 57 | 102 | 0.0 | 124 | 23 | |
| CIN | 2017 | 38 | 99 | 2.6 | 101 | 20 | |
| LAR | 2018 | 50 | 99 | 2.9 | 91 | 17 | |
| DET | 2017 | 29 | 98 | 2.7 | 111 | 19 | |
| WAS | 2016 | 34 | 98 | 2.6 | 71 | 11 | |
| ARI | 2017 | 46 | 97 | 2.7 | 123 | 22 | |
| WAS | 2020 | 40 | 97 | 2.4 | 161 | 26 | |
| SEA | 2025 | 44 | 93 | 2.0 | 63 | 13 | |
| GB | 2022 | 35 | 93 | 0.0 | 116 | 21 | |
| DET | 2021 | 19 | 93 | 2.3 | 136 | 24 | |
| DEN | 2018 | 27 | 92 | 3.1 | 128 | 23 | |
| ATL | 2020 | 32 | 88 | 2.6 | 105 | 17 | |
| SF | 2018 | 45 | 86 | 2.3 | 107 | 21 | |
| DET | 2018 | 27 | 84 | 2.7 | 147 | 27 | |
| OAK | 2019 | 29 | 82 | 1.7 | 117 | 24 | |
| DEN | 2016 | 39 | 82 | 2.8 | 82 | 14 | |
| ATL | 2021 | 40 | 82 | 2.1 | 145 | 26 | |
| OAK | 2017 | 25 | 81 | 2.3 | 161 | 30 | |
| CIN | 2025 | 23 | 80 | 2.6 | 106 | 18 | |
| ATL | 2025 | 35 | 77 | 2.5 | 119 | 23 | |
| TB | 2021 | 37 | 74 | 2.7 | 134 | 19 | |
| NO | 2022 | 35 | 70 | 0.0 | 146 | 31 | |
| DET | 2022 | 34 | 69 | 0.0 | 119 | 21 | |
| PIT | 2025 | 28 | 67 | 1.8 | 132 | 25 | |
| OAK | 2016 | 41 | 66 | 2.4 | 123 | 20 | |
| LAR | 2016 | 29 | 66 | 2.6 | 83 | 16 | |
| MIA | 2023 | 43 | 65 | 2.4 | 125 | 23 | |
| MIN | 2023 | 30 | 64 | 2.6 | 78 | 12 | |
| MIA | 2025 | 31 | 63 | 2.3 | 111 | 26 | |
| NYJ | 2019 | 33 | 62 | 2.7 | 107 | 21 | |
| SF | 2020 | 25 | 61 | 2.6 | 136 | 23 | |
| SF | 2019 | 49 | 59 | 1.8 | 103 | 22 | |
| DET | 2024 | 40 | 58 | 2.5 | 110 | 21 | |
| MIN | 2019 | 37 | 58 | 1.9 | 127 | 27 | |
| MIN | 2016 | 25 | 58 | 2.0 | 185 | 32 | |
| BAL | 2017 | 29 | 51 | 2.3 | 150 | 27 | |
| LAR | 2017 | 37 | 49 | 2.6 | 101 | 19 | |
| LV | 2023 | 40 | 47 | 2.6 | 99 | 19 | |
| MIA | 2017 | 26 | 47 | 2.7 | 114 | 20 | |
| PIT | 2021 | 24 | 47 | 2.7 | 109 | 16 | |
| BAL | 2016 | 27 | 47 | 2.5 | 170 | 25 | |
| LAR | 2024 | 32 | 46 | 2.9 | 55 | 9 | |
| OAK | 2018 | 27 | 45 | 3.0 | 132 | 25 | |
| DET | 2025 | 22 | 42 | 2.5 | 118 | 22 | |
| LAR | 2021 | 34 | 42 | 2.7 | 76 | 12 | |
| NYG | 2017 | 16 | 38 | 2.4 | 139 | 24 | |
| PIT | 2017 | 36 | 37 | 2.6 | 113 | 20 | |
| LAC | 2019 | 22 | 36 | 2.7 | 182 | 33 | |
| ARI | 2016 | 17 | 35 | 2.9 | 142 | 22 | |
| NO | 2023 | 37 | 34 | 2.4 | 133 | 23 | |
| SD | 2016 | 16 | 34 | 2.5 | 98 | 17 | |
| NE | 2019 | 28 | 32 | 2.1 | 166 | 26 | |
| LAR | 2019 | 35 | 31 | 2.8 | 62 | 10 | |
| 2023 | 8 | 30 | 0.0 | 0 | 0 | ||
| NE | 2017 | 25 | 28 | 2.3 | 158 | 27 | |
| NO | 2018 | 42 | 27 | 2.3 | 144 | 28 | |
| NO | 2019 | 37 | 27 | 2.2 | 155 | 26 | |
| NE | 2018 | 34 | 27 | 1.8 | 202 | 36 | |
| PIT | 2020 | 34 | 24 | 2.5 | 81 | 11 | |
| TB | 2020 | 39 | 22 | 2.5 | 119 | 19 | |
| NO | 2016 | 23 | 20 | 2.5 | 163 | 25 | |
| DET | 2023 | 34 | 19 | 2.5 | 101 | 17 | |
| NYG | 2018 | 16 | 18 | 2.6 | 152 | 27 | |
| CHI | 2016 | 22 | 15 | 2.6 | 86 | 15 | |
| ATL | 2024 | 30 | 11 | 2.9 | 85 | 15 | |
| IND | 2020 | 35 | 11 | 2.4 | 137 | 24 | |
| PIT | 2016 | 22 | 10 | 2.3 | 126 | 19 | |
| NO | 2017 | 36 | 10 | 2.3 | 196 | 35 | |
| LAC | 2018 | 26 | 9 | 2.4 | 141 | 26 | |
| 2022 | 0 | 0 | 0.0 | 2 | 0 | ||
| TB | 2022 | 29 | -1 | 0.0 | 145 | 20 | |
| LAC | 2017 | 23 | -7 | 2.8 | 132 | 23 | |
| NO | 2020 | 26 | -8 | 1.9 | 143 | 27 | |
| NYG | 2016 | 20 | -8 | 2.8 | 114 | 19 | |
| LAR | 2025 | 38 | -9 | 2.3 | 64 | 11 |
I then ran a regression test to see what impact, if any, that QB Rushing yards and team WR/snap have on RB team target share. After reviewing the data, I decided to remove Carolina from the results as Cam Newton IMO is an utter anomaly given his ratio of designed runs vs scrambles.
The results confirmed my suspicions. Both factors are negatively correlated to RB team target share. On average, the more a QB runs and/or the more WRs on the field, the lower the projected RB team target share. Below are the correlations (note: 1.0 is complete positive correlation, -1.0 is complete negative correlation)
- QB Rush Yards have a correlation (r) of -0.19
- WR/Snap have a correlation (r) of -0.36
- Using both variables resulted in a correlation (r) of -0.42
The formula for determining target share*100 (e.g., 20 is 20% target share) was 41.85 – 0.00574 * QB Rush Yards – 0.0785 * WRs/Snap
The average non-Panther team from 2016-2018 targeted the RBs 20.3% of the time. Using the above model based on my projected 500 QB rushing yards + 3 WRs/snap for the 2019 Cardinals nets out to a 15.4% expected RB team target share. The lowest expected RB team target share from 2016-2018 was the 2016 49ers at 15.7%.
There are of course exceptions to the rule. The 2018 Cowboys had the third lowest expected RB team target share at 16.2% and ended up with a 21% share. Conversely, the 2018 Texans had a 16.8% expected RB team target share and ended up with a 12% share.
I would posit the biggest difference between the 2018 Cowboys and Texans RB target shares was not talent (though, clearly, Elliott > Miller and Houston WR > Dallas WR) but scheme/preference. Jason Garrett loves him some screen passes. Bill O’Brien does not. I think the Cardinals’ 2019 Air Raid scheme under KK will be more BOB than Garrett.
Based on these headwinds, there are two paths I can see for David Johnson to get the Kamara-like target share that he requires to earn his ADP of #5 (without TD luck of course):
- The Cardinals run a significantly above average number of plays.
- Kingsbury tweaks the Air Raid to feed David Johnson more (spare Murray from some hits given their porous O-Line? Because Johnson is ELITE?). This could include more screen passes and/or Johnson playing a hybrid RB/slot WR role
I think #1 is a sucker bet. Projecting team snaps has little accuracy and, thus, requires a lot of regression. I have the Cardinals near the middle of the pack but I have all teams within 5% of each other.
I do not see Kingsbury getting Garrett Fever and deviating from the Air Raid to pump up RB passes. Why? An elite RB has the same YPA as a mediocre WR. The whole point of the Air Raid system is to feed the WRs. Quick passes to the WRs can also compensate for a poor O-Line and both set up greater possibilities of big plays with a missed tackle and set up the defensive backs for double moves.
I think David Johnson playing a RB/WR role, however, has some possibility. The Cardinals’ WR depth chart has non-rookie WRs of note (Larry Fitzgerald, Christian Kirk), a vet flier (Michael Crabtree), and three rookie WRs (Andy Isabella, Hakeem Butler, KeeSean Johnson) vying for playing time. Injuries, a desire to keep everyone fresh, and/or disappointing performance from the rookies could necessitate utilizing Johnson (and Chase Edmonds) in the slot.
My pre-Crabtree projections for the Cardinals is a slightly below average RB target share of 18.3% with David Johnson getting 13% share and backup Chase Edmonds getting 4.7% share (the rest of the RBs get the remaining 0.6%). If Crabtree (a historically high target per snap WR) earns playing time at the expense of the rookies (whom its best to fade on targets per snap), that will only chip away the RB target share that much more. That nets out to 77 targets for Johnson which just about matches last year’s 76 targets and is way below 2016’s 120 targets.
I would much rather bank on the safer target shares of the top WRs (Davante Adams, Julio Jones, etc.) than bank on David Johnson either being used in a novel role and/or Kliff Kingsbury screwing around with the Air Raid to feature Johnson. While Johnson is a relatively safe 1st round pick given his projected volume, the 2018 Texans’ RB target rate provide a stark reminder that a running QB + WR-heavy offense could lead to a lower target floor than an RB’s history would suggest.