
Weighing risk versus upside when it comes to drafting a player is one of the most significant ways that value is determined. The most obvious forms of risk are injury risk and age risk but we could also consider off the field concerns, situation risk (bad team, bad scheme fit), and playing time risk (competition at position) among other types of risk. This series of posts will aim to shed some light on who the more risky players are and what you should do about it. I’ll start the series by focusing on the running back position and attempting to shed some light on how risk changes as the draft proceeds. I’ll demonstrate which range (or tier) of running backs had the most risk as measured by their 2014 year end performances relative to their draft position. Later posts will focus on age and injury related risks and make some suggestions as to which early round players might be overrated this year due to those concerns.
Play fantasy football against me in the Razzball Commenter Leagues here!
Running Back Risk By ADP (Average Draft Position) Primer
Here is something you’ve probably heard before: A fantasy analyst telling you that he prefers Player A over Player B because he wants safety in the first round. I actually concur with that general line of thinking. There are plenty of first round players that have both safety and upside so that’s not really the place to choose someone with a big risk concern. Entering the middle to late rounds it’s important to keep in mind upside. More specifically, we should keep in mind what percentage chance a player has to achieve his upside (the higher, the better!). In the middle to late rounds injury concerns more or less disappear — if the player has a chance to greatly outperform his draft cost then it doesn’t matter that much whether he only does so for part of the season (due to injury).
What becomes important to note here is value over replacement. I’m not going to bother to try to precisely define what replacement level is because the details don’t matter. What matters is that we understand that value over replacement is what makes a player worth owning. In terms of the draft, players that have a ceiling that is well over replacement level are the best players to target, as long as we keep in mind the chance the player has of reaching his ceiling.
(Razzball favorite) Ahmad Bradshaw serves as a good example from 2014 of a player that both reached his ceiling and was also an injury risk. For several weeks he provided numbers that were far enough above replacement as to have made his owners very happy. Until he was injured. But because he was chosen so late in drafts the fact that he was injured didn’t really matter, you still got great production relative to his cost (in other words, value). Many of the running backs picked in the same area last year (and earlier for that matter, think Montee Ball, Zac Stacy..) were dropped long before Bradshaw was dropped. Because they were useless long before Bradshaw was useless.
Running Back Performance vs ADP
The RB position has seemed fairly volatile in recent years, the last two years in particular. I decided to analyze the points in the 2014 draft which produced the highest amount of busts (players failed to live up to a reasonable expectation relative to their draft position). The following table contains RBs sorted by their 2014 ADP along with their 2014 Standard (fractional) points scored. I placed the RBs in groups of five (except the last which is 10 because I consider it a “replacement level” group) then set a different points scored expectation level for each group. Then I looked at what percent of RBs from each group met that criteria and the average points scored for each group.
| ADP Rank | Player | 2014 Points | 2014 ADP* | Points Criteria | Criteria Met? | % That Met Criteria | Average Points for Group |
|---|---|---|---|---|---|---|---|
| 1 | LeSean McCoy | 171.4 | 3.37 | 200 | N | 60.00% | 173.3 |
| 2 | Jamaal Charles | 210.4 | 4.39 | Y | |||
| 3 | Adrian Peterson | 9.3 | 4.63 | N | |||
| 4 | Matt Forte | 244.6 | 7.84 | Y | |||
| 5 | Eddie Lacy | 230.6 | 9.17 | Y | |||
| 6 | Marshawn Lynch | 265.3 | 12.04 | 190 | Y | 60.00% | 193.4 |
| 7 | Montee Ball | 27.4 | 17.66 | N | |||
| 8 | DeMarco Murray | 294.1 | 19.15 | Y | |||
| 9 | Giovani Bernard | 144.9 | 23.43 | N | |||
| 10 | Arian Foster | 235.5 | 24.74 | Y | |||
| 11 | Doug Martin | 67.8 | 25.18 | 170 | N | 40.00% | 140.8 |
| 12 | Le’Veon Bell | 287.5 | 29.88 | Y | |||
| 13 | Alfred Morris | 170.9 | 30.01 | Y | |||
| 14 | Zac Stacy | 46.5 | 33.7 | N | |||
| 15 | Andre Ellington | 131.5 | 36.21 | N | |||
| 16 | Reggie Bush | 67 | 39.17 | 135 | N | 20.00% | 77.3 |
| 17 | C.J. Spiller | 52.5 | 46.15 | N | |||
| 18 | Ryan Mathews | 57.9 | 50.58 | N | |||
| 19 | Frank Gore | 147.7 | 54.14 | Y | |||
| 20 | Toby Gerhart | 61.2 | 55.8 | N | |||
| 21 | Shane Vereen | 113.8 | 57.35 | 125 | N | 0.00% | 76.2 |
| 22 | Rashad Jennings | 108.5 | 59.23 | N | |||
| 23 | Ray Rice | 0 | 62.35 | N | |||
| 24 | Ben Tate | 67.1 | 63.31 | N | |||
| 25 | Chris Johnson | 91.4 | 63.66 | N | |||
| 26 | Bishop Sankey | 78.2 | 67.07 | 115 | N | 20.00% | 85 |
| 27 | Trent Richardson | 90.8 | 70.57 | N | |||
| 28 | Joique Bell | 164.2 | 73.23 | Y | |||
| 29 | Maurice Jones-Drew | 13.7 | 86.02 | N | |||
| 30 | Pierre Thomas | 78 | 93.18 | N | |||
| 31 | Knowshon Moreno | 21.6 | 93.4 | 110 | N | 60.00% | 98.8 |
| 32 | Steven Jackson | 121.5 | 95.07 | Y | |||
| 33 | Stevan Ridley | 48 | 95.64 | N | |||
| 34 | Lamar Miller | 185.4 | 100.49 | Y | |||
| 35 | Darren Sproles | 117.6 | 102.72 | Y | |||
| 36 | Fred Jackson | 122.6 | 107.69 | 100 | Y | 40.00% | 80.5 |
| 37 | Carlos Hyde | 62.1 | 108.51 | N | |||
| 38 | Danny Woodhead | 7.2 | 117.48 | N | |||
| 39 | Bernard Pierce | 47.9 | 120.61 | N | |||
| 40 | Mark Ingram | 162.9 | 121.52 | Y | |||
| 41 | Devonta Freeman | 57.3 | 124.16 | 96 | N | 40.00% | 87.7 |
| 42 | DeAngelo Williams | 24.3 | 124.46 | N | |||
| 43 | Jeremy Hill | 183.9 | 125.88 | Y | |||
| 44 | Darren McFadden | 84.6 | 131.61 | N | |||
| 45 | Terrance West | 101.7 | 134.79 | Y | |||
| 46 | Andre Williams | 127.1 | 136.81 | Y | |||
| 47 | Khiry Robinson | 56.5 | 143.82 | N | |||
| 48 | Christine Michael | 18.7 | 144.48 | N | |||
| 49 | LeGarrette Blount | 88.1 | 148.68 | N | |||
| 50 | Chris Ivory | 134.4 | 149.28 | Y |
*I used ADP data from myfantasyleague.com.
Before really digging into the results I’d like to note that one year worth of data is not enough to make any predictive claims. So that’s not what I’m trying to do. The purpose is to use what happened last year to get a very general sense of what could happen this year.
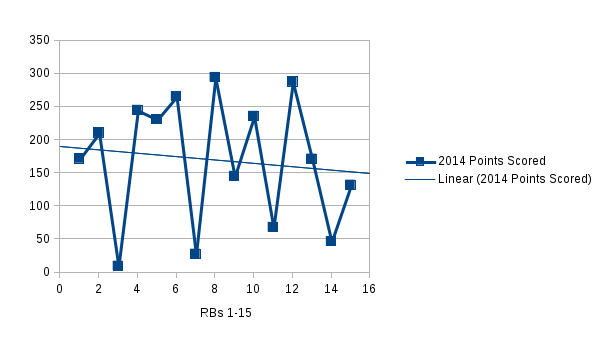
By this criteria the first 15 RBs were a fairly reliable group, with 8 out of 15 (53.3%) of them meeting their criteria. And realistically, what’s the highest rate we’d expect? Every year we lose some guys to injury, so 10 out of 15 would be about as high as we could reasonably expect and the top 3 groups as a whole came near that mark. As far as average points scored, the first three groups scored 87%, 102% and 83% of their respective points criteria.
After the first three groups things got really ugly. The RBs 16-50 by ADP, as a group, met their expectation 37.1% of the time (13 of 35) and the groups in the 16-50 range scored 57%, 61%, 74%, 90%, 81%, and 91% of their respective points criteria. It was actually the worst for the RBs in the 16-25 range as only 1 out of 10 of them met their criteria. Which might cause one to wonder if my criteria was too high for those groups. Certainly there was nothing scientific about my choosing of the criteria but without going into detail, I’ll just say it wasn’t haphazard either. So for group four, for instance, RBs 16-20, only one of them scored above 70 points. Unless I’m changing the criteria down from 135 points to 60 points, nothing is changing as far as the percent of RBs in that range who qualified as worthy.
Back to that 4th group (RBs drafted 16-20th, aka “the Reggie Bush group”), what happened is it consisted of Reggie Bush, CJ Spiller, Ryan Mathews, Frank Gore and Toby Gerhart. Four out of five of those players suffered injuries last year. I think we had reason to suspect going into last year that some of these players were above average injury risks. However, I do think that this group had some pretty high upside so I understand why people were drafting them there, yet it’s also fair to say their injury risk was underestimated.
Now I’ve got some charts for you that help to illustrate the same thing as the table, then I’ll finally tie this back into the discussion of risk.
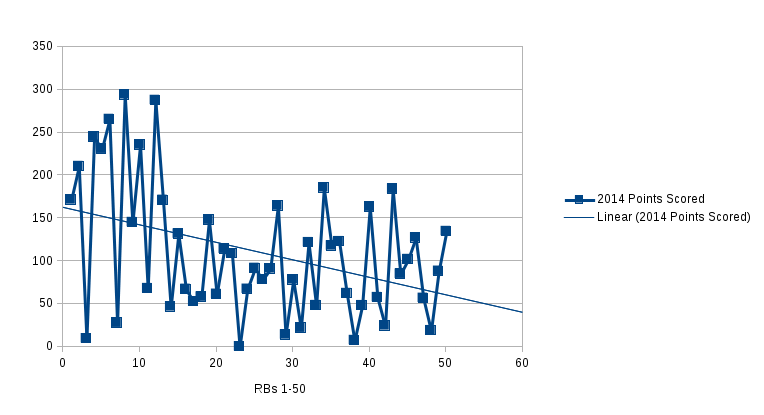
The vertical axis is points scored, the horizontal axis is running back ADP rank (that is, the first running back chosen on the average has ADP rank 1). The chart above shows the entire group, RBs 1-50 by ADP along with a linear trend line. It turns out that trend line is somewhat misleading. I’ll show you what I mean by breaking it up into two groups. Here’s just the first 15 RBs:
And here’s just the RBs 16-50:
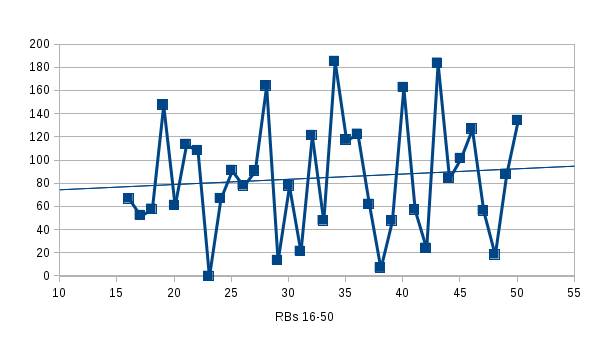
Okay, so now the trend line is pointed upwards! The later you draft a RB the more productivity you get, relative to the productivity of the RBs taken 16-25! Okay, so you got me. That doesn’t make sense. While this is what actually happened last year, I think in general the trend line should have probably decreased slightly or been flat, which is still telling.
Let’s briefly consider those blips high up on the chart and if they were the cause of the trend line going upwards. Those blips are Lamar Miller (drafted as RB34 last year), Mark Ingram (RB40) and Jeremy Hill (RB43). Even if they had performed at a level that only barely met the criteria for the ADP group they were in, the graph still trends slightly upwards. So it wasn’t about the performance of a few outliers. Plus, we don’t even have enough data here to determine if they should be considered outliers. On the other hand, the chart would look somewhat as expected, trending slightly downwards, if those exceptional running backs had each been taken 15 spots earlier. But that’s not what happened.
If you were wondering why I didn’t include data from other years it’s because it would be time consuming (by methods known to me/currently at my disposal) to gather data before 2013. So while I could have somewhat easily included 2013 with 2014, I highly doubt the inclusion of that data would change the narrative. I’ll probably go ahead and save the 2013 data for use next year, at that time perhaps I’ll combine 2013-2015 data and see what these charts look like.
I’d also like to note that in all fairness I think one potentially meaningful thing this data neglects are those running backs that were useful but only for a small portion of the season. LeGarrette Blount’s games with the Patriots come to mind. And heck even Ryan Mathews, for instance, was slightly more useful than his 57.9 points imply.
Managing the ADP Related Risk
So now tying all of this into risk… The running backs taken early performed at a level that I think roughly lines up with expectations. I think it also tells why we should be careful putting a running back such as Ryan Mathews (and we know Jay’s already repented for doing this last year) or Arian Foster in the first round. With other relatively safe choices available, why risk wasting such an expensive pick on a known injury risk? Foster ended up being a bargain last year because he played 13 games but that drove his cost back into the first round this year (before his injury) and we already how that turned out… (And I’ll have much more in injury risk next time).
For the running backs taken later, I think there are two takeaways: The first is that the RB position seems very risky (or prone to busts) in the early part of the middle rounds, think rounds 5-8. Certainly you might be better off shifting the RBs in that range downward slightly in your rankings to make it more likely that you’ll draft wide receivers or perhaps players from any of the other position groups in that range. But that’s a bit presumptuous because we haven’t seen the bust rates for wide receivers and others.
The other takeaway is that due to the volatility of 2014 performance results from these running backs there really isn’t any reason to think someone is wrong for having a running back that most analysts rank as RB-40ish moved all the way up to RB-30ish in your rankings (you wouldn’t move him up any higher than that because you shouldn’t have to in order to obtain him). And what would make you want to move that running back up? Upside. To me the number one point of this is that it’s all about upside past the first few rounds. That doesn’t mean you take the player who could explode if, this, this, this and that all go his way. Almost any running back can succeed if a great number of events conspire to bring up his value.
It means we need to do a better job of identifying which running backs are most likely to achieve their upside. So looking at last year’s successful backs, what did Lamar Miller, Mark Ingram, Jeremy Hill and C.J. Anderson have in common, aside from outstanding 2014 performances?
Talent. We know now that this is a very talented group. But were these running backs seen as talented players before the season started? Yes, I’d say they were. For Lamar Miller, there was some doubt headed into 2014 but he was certainly seen as talented headed into 2013, the doubt was cast due to the coaching staff apparently not seeing it (in 2013). Mark Ingram was a player with a fair amount of buzz last year and I think that had to due with both his opportunity and his talent. Jeremy Hill was a player we were fairly sure was well above average talent headed into 2014 (some analysts even suspected before the season started that he was a more talented player than Gio Bernard), it was just a question of how big a role he would play. There was only a slight buzz for C.J. Anderson in the 2014 preseason but that buzz was there. So the talent was there but what really made these players go off?
They just needed the opportunity. In 3 out of the 4 cases greater opportunity arose due to injury of the starter, as Moreno, Bernard and Ball all went down. However I think it’s likely that Miller and Hill would have been solid even without the benefit of injury to their competition as their talent would have eventually led their coaches to give them a fairly large role. C.J. Anderson is an example of just how long it can take for talent and opportunity to meet and how seemingly random fantasy football can be.
The other thing they have in common is that they played for average to very good offenses. No bad offenses in the bunch.
Some Names To Consider
So with that in mind I’ll name some players who I think have a good chance to perform at a higher than expected level. Consider drafting them as our RB3 or RB4. Now that we know that essentially every running back picked in the early part of the middle rounds has higher than expected risk, I think we can be slightly less concerned about particular any risk a particular running back is said to have. What I mean is, it’s unfair to single out a certain player as a risk when in fact the group as a whole is risky (think back to the Ahmad Bradshaw example from earlier). As you read these names you may want to compare them to the players drafted last year in similar spots. Hopefully these players have a higher chance to reach their ceiling than some of the busts from last year.
- Joseph Randle (ADP 55.7) Has question marks but no realistic competition in Dallas. And now we have a better idea that even the backs whose question marks seemed minor headed into last year can bust (Zac Stacy, anyone?). That makes him seem less risky at this spot considering his ceiling.
- Arian Foster (ADP 63.3) Now that we suspect that running backs taken in this range are somewhat unlikely to be difference makers, why not take one that is guaranteed to perform well for as long as he’s healthy? Honestly though that ADP moved up a lot (reflected above) since I first had him here but if you want to take a RB in this ADP range I doubt you can find a more useful one.
- Ameer Abdullah (ADP 80.7) I do worry because he’s a small-ish running back (a la Andre Ellington) so I think that caps his upside, but Detroit will give him a shot to earn 10-15 touches per game and that’s plenty for a back with Abdullah’s explosiveness. Plus Joique Bell is already injured.
- Tevin Coleman (ADP 89.0) We know that Coleman’s primary competition, Devonta Freeman, had the entirety of 2014 to make a claim for the starting role this year and he really didn’t do much at all, even though a mediocre at best Steven Jackson was his primary competition. It has the makings of a timeshare but Tevin Coleman has the best chance to get the best role — early down plus goal line work.
- Tre Mason (ADP 105.7) The problem with Tre is he plays for a below average offense and is only an early down back, but on the plus side, we don’t know how healthy Todd Gurley is. Plus we don’t yet know if Gurley is a better NFL running back than Mason. Yeah I just said that. Because it’s true. And if there’s a 30% chance that Gurley isn’t (yet) a better NFL running back than Mason, it seems like that’s a 30% chance for Mason to greatly exceed his draft value. That’s actually a pretty high mark. Plus he’s extremely likely to get most of the work during the first couple weeks because right now the reports are that Gurley won’t play to start the season.
- Jonas Gray (ADP 136.8) I know that it’s hard to trust a New England running back. I know that LeGarrette Blount looks like the back poised to have the biggest year. I also know that Blount will miss the first game due to suspension and I suspect that Gray will have a chance to prove himself during that game. There’s nothing but upside at this draft spot. No, he isn’t particularly talented, but neither is Blount.
You can find all of that ADP yourself on FantasyPros.
Maybe you have a different list of mid-late running backs you are targeting. The important thing to note is that if last year repeats itself we’ll find just as many difference makers at the running back position in the 9th-12th rounds as we will in the 5th-8th rounds and that tells me we should try to avoid questionable running backs in rounds 5-8 and instead take players of other positions (although I’ll repeat this is just a suspicion because I don’t have data for the other positions).
In conclusion, I believe the results from the running backs drafted early last year actually reinforces the ages old concept of taking running backs early (at least in Standard scoring, PPR may very well be a different story). The first five off the board last year had a chance to be a very special group but that was thwarted in large part because of Adrian Peterson. But that group was still solid. The next five were also good, as a whole. Because we usually have reliable choices at the beginning of the draft that’s not a place to take unnecessary risks. As the draft proceeds, there really is no wrong draft choice at the running back position because history suggests it’s a crap shoot, but hopefully you’ll have superior information than your opponents to make better informed guesses.
My next post will cover the risk for the players near the top of the draft board, with a focus on injury risk, and fortunately not just running backs. As a sneak preview, I think Odell Beckham and Julio Jones have more risk than they are generally perceived as having…
RotoLance is also on Twitter @RotoLance.